How to Calculate Days in Inventory for Your Store
September 23, 2026 · 15 min read · Dylan Klichowicz
You've bought stock, taken product photos, built the store, and now sales are trickling in. The money feels busy, but a lot of it is still sitting in boxes on a shelf, waiting for someone to click “buy”. That gap between buying stock and selling it is exactly where days in inventory helps you think more clearly about cash, reorders, and what's really happening in your store.
Days in inventory is a simple way to show how long your stock sits before it turns into a sale. In South African training material, it's commonly presented as the number of days it takes inventory to move from purchase or manufacture to sale, and a University of South Africa tutorial shows the calculation method with inventory-days examples of 236 days and 221/228 days, plus a policy target of 150 days for inventory-holding days (UNISA tutorial PDF). For a small jewellery brand, that can mean the difference between cash that can fund your next batch and cash that's locked up in rings nobody has bought yet.

Table of Contents
- Why Days in Inventory Matters for Your Online Store
- The Simple Formula and Where to Find Your Numbers in Shopstar
- Worked Examples for a Small South African Store
- How to Calculate Days in Inventory in Excel and Google Sheets
- Common Variations Pitfalls and How to Avoid Them
- What Your Number Means and How to Reduce It Wisely
Why Days in Inventory Matters for Your Online Store
A first-time seller often thinks stock is only a product problem. In reality, it's a cash problem too. If you imported candle jars, bought fabric, or stocked handmade earrings for your online store, each item on the shelf is money you've already spent, and days in inventory tells you how long that money waits before it comes back.
For South African makers, that matters because slow-moving stock can squeeze buying power fast. A short number often means stock is moving quickly, but a very short number can also mean you're running too close to empty and risking missed sales. A long number can mean you've bought too much, priced too high, or chosen products that aren't moving well.
Think of it as shelf time, not stock count
The number is not about how many units you have. It's about time. South African working capital material uses the annual formula for average age of inventory as 365 x (Inventories ÷ purchases), which reinforces that this is a timing measure, not a warehouse count (Shopify ZA article).
That's why store owners should read it alongside real buying behaviour. If your Shopstar dashboard shows steady sales but your stock sits for months, the number is telling you to slow down buying or review your range. If your stock disappears too quickly, the number may be warning you that your supply chain can't keep up.
Practical rule: a lower number isn't automatically better. In South Africa's supply environment, the right answer depends on lead times, supplier reliability, and how badly a stockout would hurt your sales.
For makers and small e-commerce brands, this metric helps with three everyday decisions, how much to reorder, when to discount slow movers, and whether a product line deserves more cash. That's why it belongs in the same conversation as your sales report and inventory report, not in a separate finance file nobody opens.
The Simple Formula and Where to Find Your Numbers in Shopstar
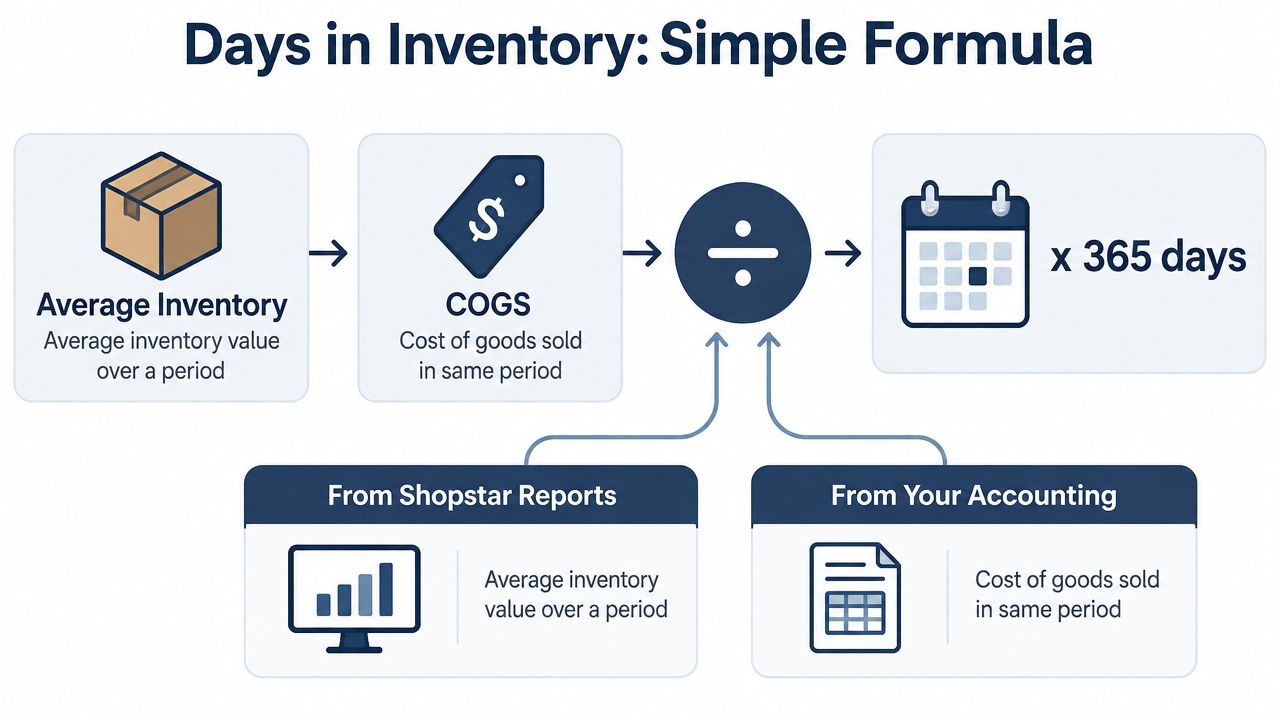
The common formula for days in inventory is:
Average Inventory ÷ Cost of Goods Sold x 365
A closely related version uses turnover:
365 ÷ Inventory Turnover
Both point to the same idea, how long stock stays in the business before it leaves as a sale. The first formula is the one most small store owners find easiest to work with, because it connects directly to the money value of stock and the money value of what you sold.
What each input actually means
Average inventory is the usual value of your stock over a period. If you only use the closing stock balance, you can get a distorted result when you bought a lot of stock near month-end. Average inventory smooths that out.
COGS, or cost of goods sold, is the cost of the items you sold in that period. For a jewellery brand, that's the cost of the beads, metal, packaging, or finished pieces that left the shelf. It is not your selling price.
If you want to use the purchase-based version seen in some South African tutorials, the same logic applies. The standard annual formula for average age of inventory is presented as 365 x (Inventories ÷ purchases) in South African working capital material, which keeps the focus on time rather than unit counts (Shopify ZA article).
Where to pull the numbers from
In a small store, you usually pull inventory values from your stock report and COGS from your sales and product cost records. If you're using Shopstar, the inventory management dashboard is the natural place to check stock value movements across products, and the sales and product reports help you line up what sold with what it cost, using the figures in your store records (Shopstar inventory management dashboard).
If your numbers come from different systems, keep them on the same time period. A monthly inventory value with a yearly cost number will give you nonsense. For annual calculations, 365 days is the standard choice. Some South African training materials also use 360 days, so the key is to stay consistent within one method instead of mixing conventions.
For owners trying to separate product costs from overheads, it helps to break down fixed and variable. That keeps COGS clean and stops rent, tools, or salaries from sneaking into the calculation.
The easiest way to think about the formula is simple. Take the average value of stock, divide it by the cost of the goods sold in the same period, then multiply by the number of days in that period. If the answer is high, stock is sitting longer. If it's low, stock is moving faster.
Worked Examples for a Small South African Store
Here are two worked calculations using realistic South African store values. The first uses 365 days with average inventory and COGS. The second uses 360 days with inventory and purchases. A university tutorial also shows the calculation [7 562 / (10 046 + (7 562 – 6 068)] x 360, producing 236 days (UNISA tutorial PDF).
Example one using average inventory and COGS
Say your handmade jewellery store's average inventory value was R48 000 for the year. Your COGS for that same year was R96 000.
The formula is:
Days in inventory = Average inventory ÷ COGS x 365
Work through it in two steps:
R48 000 ÷ R96 000 = 0.5
0.5 x 365 = 182.5 days
Rounded to the nearest whole day, the result is 183 days. Your stock is therefore held for about six months before it turns into sales. That may suit a jewellery brand selling made-to-order pieces or seasonal collections. It may also show that you are carrying too many designs or buying materials before demand is clear.
A high result is a prompt for investigation, not an automatic failure. Check the range, pricing, buying pattern, and Shopstar stock records before changing your ordering decisions. A volatile supply environment can make a higher DII sensible if imported materials are difficult to replace or supplier lead times are uncertain. The cash cost of holding stock must still be weighed against the risk of running out.
If stock is ageing, review Shopstar's net realisable value guide before deciding whether to discount it or write it down.
Example two using purchases and the 360-day convention
Now use a purchase-based method found in some South African study material. Suppose your inventory value is R60 000 and your annual purchases total R120 000.
Days in inventory = Inventories ÷ purchases x 360
The working is:
R60 000 ÷ R120 000 = 0.5
0.5 x 360 = 180 days
The result is 180 days. It differs slightly from the first example because the calculation uses 360 rather than 365, and purchases rather than COGS. A report using one method should not be compared directly with a report using the other.
| Worked Days in Inventory Examples Compared | |||
|---|---|---|---|
| Example | Inputs Used | Formula Applied | Result in Days |
| Jewellery store, average inventory and COGS | Average inventory R48 000, COGS R96 000 | R48 000 ÷ R96 000 x 365 | 183 |
| Small store, inventory and purchases | Inventory R60 000, purchases R120 000 | R60 000 ÷ R120 000 x 360 | 180 |
For a Shopstar store owner, the direction matters more than a decimal. A rising monthly result means stock is lingering. A sharp fall may mean products are selling faster than you can replace them, which can lead to missed orders. Compare like with like, then choose stock levels that protect both cash flow and availability.
How to Calculate Days in Inventory in Excel and Google Sheets
Once you've done the maths by hand, the spreadsheet version saves time and helps you track trends month by month. That matters because one month's number can mislead you, while a running sheet shows whether your stock is improving or drifting in the wrong direction.

Basic spreadsheet setup
Put your opening inventory in one cell, your closing inventory in another, and your COGS in a third. Then calculate average inventory with:
=(Opening Inventory + Closing Inventory) / 2
After that, use:
=(Average Inventory / COGS) * 365
If you're working with monthly data, the same structure still works, but you need to be consistent about the time period. Don't multiply a monthly calculation by 365 unless you've first annualised the cost number. If you want a rolling monthly tracker, use a monthly COGS total and keep the period aligned.
For Google Sheets or Excel, a simple version looks like this:
=((B2+C2)/2)/D2*365
Where B2 is opening inventory, C2 is closing inventory, and D2 is COGS.
A cleaner formula for repeated reporting
If you're tracking multiple months, you can create one row per month and copy the formula across. That makes it easier to spot whether stock is ageing or moving faster. The What-if analysis guide is useful if you want to test how a change in buying or sales would affect the result before you place your next order.
For divide-by-zero errors, wrap the formula in an error check. In Excel or Sheets, that can look like:
=IFERROR(((B2+C2)/2)/D2*365,"")
That way, the sheet stays clean if a COGS cell is blank. It's a small thing, but it stops you from chasing false warnings.
Later on, if you want to automate more of your stock tracking, add a second sheet for exports from your store and make sure product cost, stock value, and sales periods all line up. A quick sanity check is simple. If the spreadsheet result doesn't match your hand calculation for the same month, one of the inputs is off.
Common Variations Pitfalls and How to Avoid Them
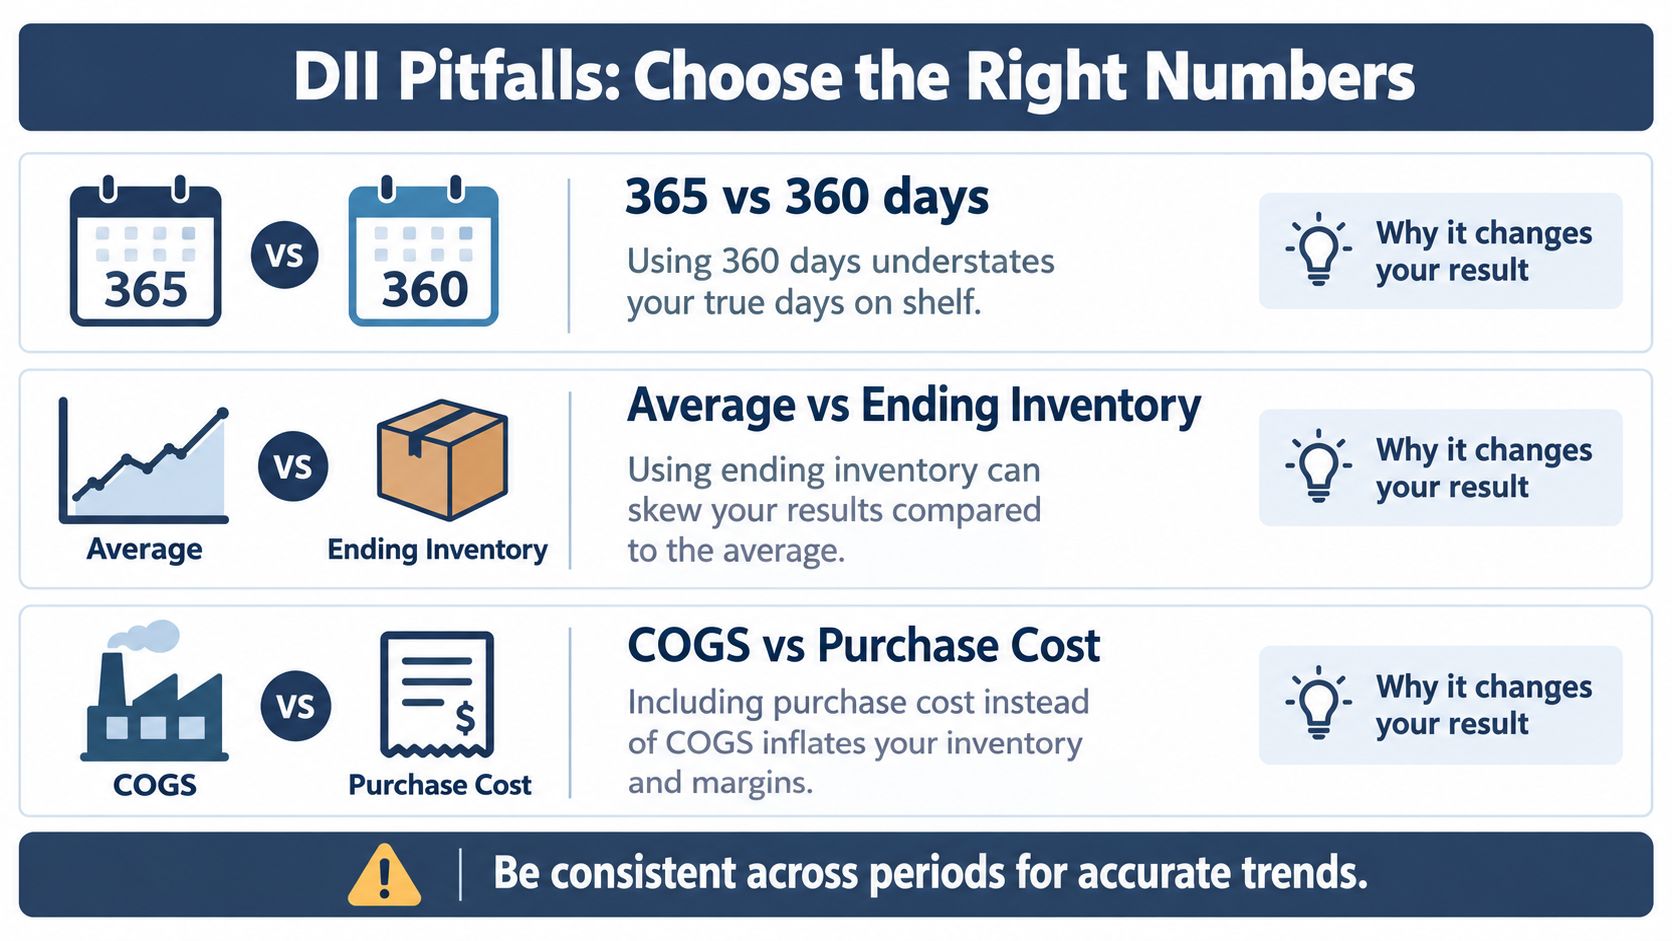
The biggest mistakes usually happen before the maths even starts. Someone uses the wrong period, mixes stock values with selling prices, or compares a 360-day result with a 365-day result and thinks the business changed more than it really did.
The choice that changes the answer
| Choice | What it does | Simple fix |
|---|---|---|
| 365 vs 360 days | Changes the final answer slightly | Use one convention every time |
| Average vs ending inventory | Can distort a period with big purchases | Use average inventory for trend tracking |
| COGS vs purchase cost | Can change whether you're measuring sales flow or buying flow | Keep the denominator aligned with your report |
| Period mismatch | Makes the result meaningless | Match the inventory period to the cost period |
The 365-day version is common in annual reporting. The 360-day version shows up in some South African training material, so the key is not which one feels more familiar. The key is using the same method month after month so your trend line stays honest.
South African pitfalls that catch beginners
A common mistake is to mix selling prices with cost figures. If you use retail prices for stock but cost prices for sales, the answer becomes useless. Another issue is VAT-inclusive figures sneaking into one side of the formula and VAT-exclusive figures on the other side.
Be consistent across periods for accurate trends.
Stock counts can also confuse the picture if the team does them on different dates each month. One count taken before a busy weekend and the next taken after a heavy sales week will not tell you the same story. If you manage a handmade store with seasonal spikes, use the same cut-off date for every report.
For a young e-commerce brand, the safest habit is to tie every inventory number back to one clean source of truth. If your sales report, inventory report, and bookkeeping file don't agree, stop and fix that first. The formula is simple, but bad inputs make it lie.
What Your Number Means and How to Reduce It Wisely
A days-in-inventory result is useful when it leads to a sensible decision, not a panic order or sudden clearance sale. South African training material may use a policy target of 150 days, but that is a reference point rather than a rule for every store. A jewellery maker with long supplier lead times, custom work, or slow replenishment may need more cover than a fast-moving accessory shop.
Longer inventory turnover periods are associated with weaker profitability in South African research, with a reported coefficient of -0.31. Over a 365-day period, a longer turnover time can reduce operating profit margins by up to 31% in competing entities. The result deserves attention, but your product type, sales rhythm, and supply risk give it meaning.
When a higher number is the smarter choice
In South Africa's volatile supply environment, too little stock can cost sales just as excess stock ties up cash. If a supplier is unreliable, lead times are long, or a product takes time to remake, holding a slightly higher number may protect your income. Inventory guidance also connects stock age with replenishment planning and cash flow, rather than treating a lower figure as the only goal (Shopify ZA retail article).
For a maker, this could mean keeping enough materials for a best-selling necklace even when the dashboard shows more days than your usual target. If that necklace sells out and replacement stock arrives late, the missed order may cost more than the cash held in materials for a short period. Ask whether your stock level matches both customer demand and supplier risk.
Practical ways to bring it down without breaking sales
- Buy smaller batches: Smaller orders limit how long untested products sit on the shelf.
- Bundle slow movers: Pair ageing stock with a popular product that customers already want.
- Improve product pages: Clear photos and descriptions help shoppers understand the item and decide sooner.
- Track reorders closely: In Shopstar analytics and the store dashboard, compare sales movement before placing another order.
- Review weak ranges regularly: If a product keeps ageing, reduce the range, change the offer, or stop buying it before more cash is tied up.
If manual checking takes too long, you can also find enterprise-ready AI tools that help retail teams sort reports and spot patterns faster. In a small store, software can flag an unusual result, while your product knowledge decides whether to order less, reprice an item, or hold stock for longer.
Watch the trend rather than one isolated figure. A gradual fall alongside healthy sales usually points in the right direction. A fall caused by running out of stock means the calculation improved while the business lost orders.
Set up products, sales, and inventory in one place so you can check the result without searching through several spreadsheets. Shopstar gives South African makers a dashboard for stock, orders, and sales, making it easier to monitor days in inventory and respond before cash remains tied up on the shelf.