Ecommerce Analysis Report Guide for South African Sellers
September 30, 2026 · 16 min read · Elizora Yarnell
A long weekend sale can leave a small business owner with more questions than orders. You open the store dashboard, see revenue, visitors, refunds, payment methods and abandoned carts, then wonder which number deserves your attention first. The spreadsheet looks busy, but busy isn't the same as useful.
An ecommerce analysis report turns that pile of figures into a plain business story. For a South African maker, it should explain what sold, who bought it, where shoppers dropped out and which action could improve the next trading period. You don't need a data science degree, or a dashboard that looks like it belongs in a space station.
Table of Contents
- What an Ecommerce Analysis Report Actually Does
- The Key Metrics Every Beginner Should Track
- Where the Numbers Come From in South Africa
- A Simple Template You Can Copy This Week
- Charts That Earn Their Place
- Turning Your Report Into Better Sales
- Building a Reporting Habit That Lasts
What an Ecommerce Analysis Report Actually Does
Lerato makes scented candles in Woodstock. After a promotion, she sees that orders increased, but several customers requested refunds and plenty of visitors left before paying. Her dashboard contains enough figures to keep her occupied for an afternoon, yet it doesn't immediately tell her whether the promotion made money or just created more admin.
An ecommerce analysis report is a short, readable summary of the store's performance. It brings together sales, traffic, customer and cost information, then adds an explanation of what changed and what the owner should do next. Think of it as a mechanic's diagnostic slip for an online shop. It doesn't just say that the engine made a strange noise. It points towards the likely problem.
Practical rule: Every number in the report should help you answer a business question.
The report isn't a tax return, and it isn't a formal financial statement. A financial statement serves accounting and compliance needs. An ecommerce analysis report is a working tool for decisions, such as whether to restock a popular candle, change a product page, test a different payment option or stop spending on a weak campaign.
The three questions behind the report
A useful report answers three quiet questions:
- What sold? Look at revenue, orders, units, products and average order value.
- Who bought? Separate new and returning customers, then review location and buying behaviour.
- Where is the shop leaking money? Check refunds, shipping costs, abandoned carts, failed payments and products that attract attention without producing orders.
For a South African business, context matters. The long-term expansion of local online commerce gives sellers a useful market backdrop, and the South African export FX insights resource can help a business owner think more carefully about reporting when international payments or currency exposure enters the picture.
Lerato doesn't need twenty charts. She needs a short report that says, in everyday language, “These products carried the week, mobile shoppers struggled at payment, and this is the fix we'll test next.” The rest of this guide shows you the metrics, layout and charts that make that kind of report possible.
The Key Metrics Every Beginner Should Track
Start with a small set of measures. A beginner's report should be detailed enough to reveal a problem, but not so crowded that the owner stops opening it.
Sales metrics
Total revenue is the money recorded from orders during the selected period. Check whether your platform shows sales before or after refunds, discounts and shipping, because the label can hide important differences. Units sold tells you how many items moved, while average order value, calculated as revenue divided by orders, shows the typical basket size. Sell-through rate compares units sold with available stock. It helps a jewellery maker see whether a slow-moving earring design needs better merchandising or needs more time.
Traffic and conversion metrics
Sessions count visits to the store, while conversion rate measures the share of sessions that end in a purchase. A South African benchmark places conversion at about 1.5%, add-to-cart at 9.4% and cart abandonment at 83.5%, according to local ecommerce conversion benchmarks. The same benchmark notes that add-to-cart rates in 2025 were roughly 9.5% to 10%, while abandonment remained around 84%, so a busy shop can still lose many interested buyers at checkout.
Bounce rate shows how often visitors leave without meaningful interaction. Treat it as a clue, not a verdict. A person who visits one product page, reads carefully and leaves may still have found the store useful. Add-to-cart rate is often more actionable for a small shop because it shows whether the product, price and page persuaded someone to consider buying.
If you want to understand how marketing cost fits into sales performance, this ROI calculation guide offers a useful starting point.
Customer and money metrics
Track new versus returning buyers to see whether sales depend entirely on constant promotion. Customer lifetime value is a longer-term estimate of the revenue a customer may generate, but beginners can start by watching repeat purchases rather than pretending to predict the future. Basic location and device information can also reveal whether a Cape Town promotion is reaching Durban shoppers or whether mobile visitors need a different experience.
Gross margin is the amount left after the direct cost of making or buying the product. Payment method split shows whether customers use cards, EFT, wallets or other available options. Refund rate and shipping cost per order protect you from celebrating revenue that doesn't leave enough money in the business.
| Metric | Bucket | Plain definition | Rough ZA benchmark |
|---|---|---|---|
| Revenue | Sales | Money recorded from orders | No single benchmark supplied |
| Units sold | Sales | Number of products sold | Compare with your own stock and period |
| Average order value | Sales | Typical value of one order | Use your own product mix as the baseline |
| Sessions | Traffic | Visits to the store | Compare by source and device |
| Conversion rate | Traffic | Share of sessions that become orders | About 1.5% in the cited local benchmark |
| Add-to-cart rate | Traffic | Share of visits adding an item to cart | About 9.4% in the cited local benchmark |
| Cart abandonment | Traffic | Carts that don't become completed orders | About 83.5% in the cited local benchmark |
| Repeat purchase rate | Customer | Share of customers who buy again | Build your own baseline first |
| Gross margin | Money | Revenue left after direct product cost | Calculate by product, not only store-wide |
| Refund rate | Money | Share of orders or revenue refunded | Compare with your own reasons and products |
If Sunday night only gives you time for one screen, start with revenue and orders, conversion and add-to-cart, then payment and refund information. Those figures tell you whether people arrived, showed buying intent and successfully completed the transaction.
Where the Numbers Come From in South Africa
Your store has one story. The market has another. An honest ecommerce analysis report uses both without mixing them up.
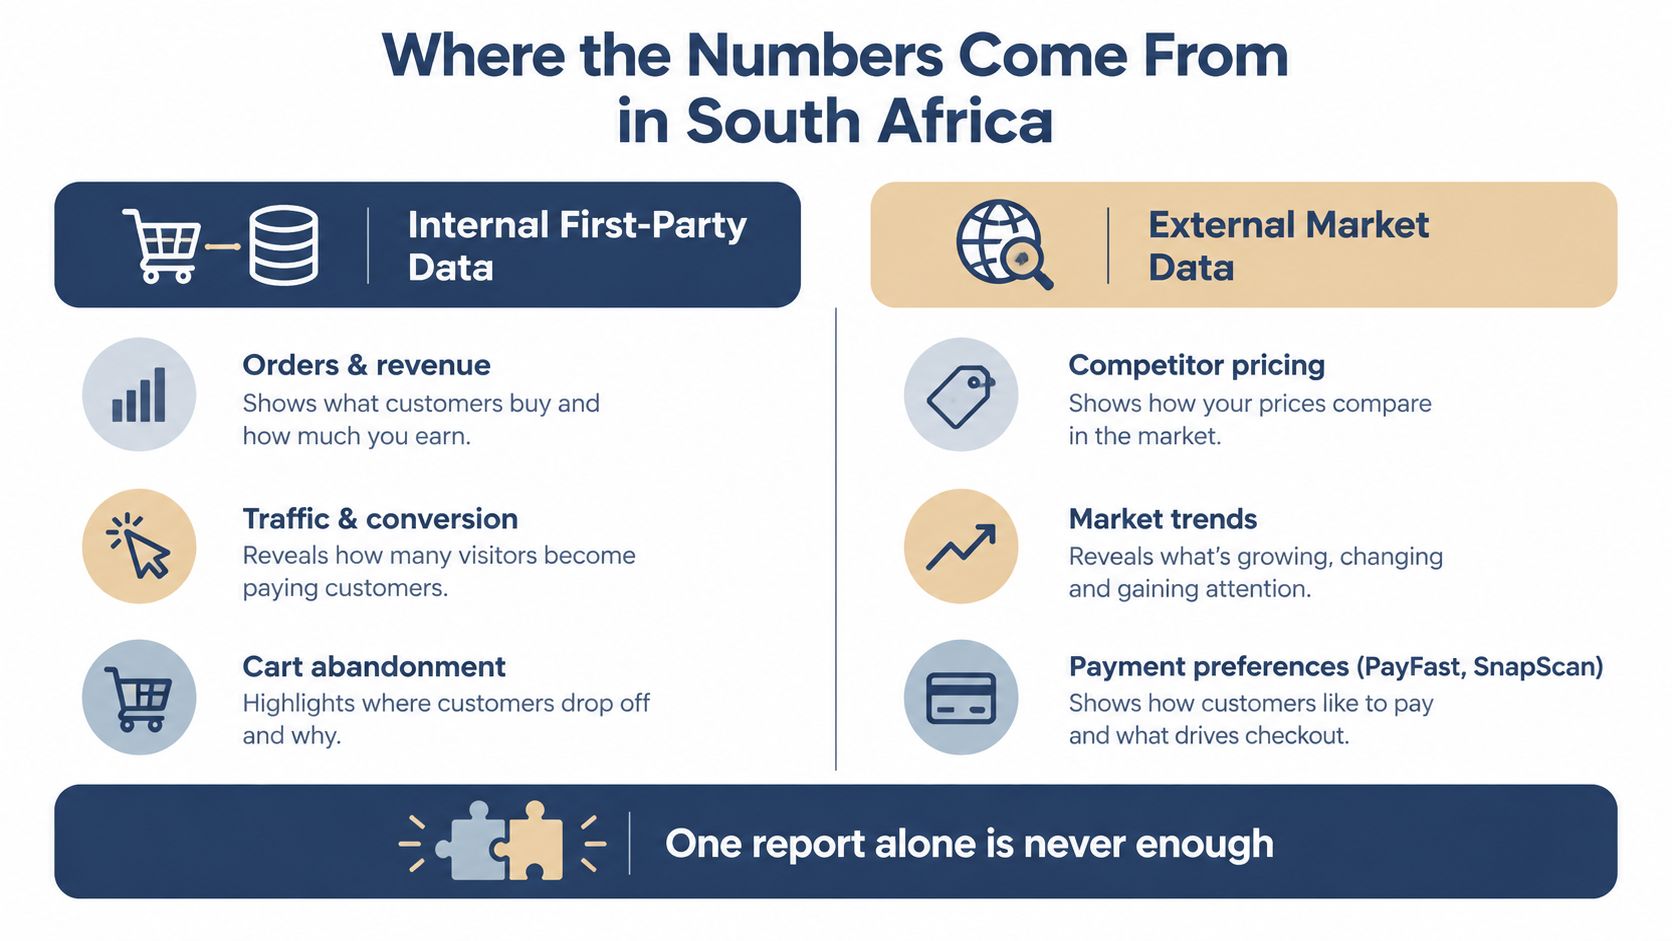
Internal first-party data comes from the systems you control. A store platform can show orders, revenue, products, customers, checkout steps, payment method and device type. This data is closest to the transaction, so it's the best place to answer questions such as, “Did my green gemstone necklace sell more than the silver version?” or “Do mobile shoppers abandon payment more often than desktop shoppers?”
Its weakness is scale. Your store data can tell you what happened to your visitors, but it can't tell you whether a change is unique to your business or part of a wider South African pattern.
External market data supplies that wider context. Statistics South Africa reported that income from ecommerce sales rose from R37.4 billion in 2018 to R86.8 billion in 2022, while ecommerce's contribution to total sales rose from 3.9% to 7.7%, as reported in official South African ecommerce coverage. Those figures don't predict your candle sales, but they show that online commerce has become structurally more important in the local retail economy.
What each source can and can't tell you
Internal data is specific and operational. It helps you find a broken checkout step, a weak product page or a payment method that customers prefer. External data is broad and directional. It helps with market sizing, planning and understanding local changes in retail, devices and payment behaviour.
Recent reporting estimated South African online retail at R159 billion in 2026, with online shopping reaching about 10% of total retail turnover, and placed 2025 online retail at around R130 billion. These are market estimates and reporting projections, not a promise that every small seller will grow at the same pace. You can review the context in South African online retail reporting.
A practical report might contain a Shopstar export, a page showing your own funnel, and one or two slides of market context. Keep the comparison honest. Don't compare your store's conversion rate with a national retail value as if they measure the same thing. One describes your shop's behaviour. The other describes the size and direction of a market.
For an accessible introduction to the tools and events worth tracking, see these ecommerce tracking tools. The aim isn't to collect every possible data source. It's to combine enough internal and external information to explain what happened and decide what to test next.
A Simple Template You Can Copy This Week
A good report resembles a layered sandwich. Start with the part everyone can understand, then add the details someone needs to investigate a problem.
Start with the headline
Open with one paragraph that names the store, date range and main result. Use plain language rather than a dashboard label:
“The jewellery store sold more pieces this month, but mobile shoppers were less likely to complete payment. The next test is a shorter mobile checkout and a clearer delivery message.”
That opening gives the reader a conclusion before the supporting figures arrive. It also prevents the common mistake of making someone dig through five pages to discover the point.
Add the evidence in a fixed order
Use the following order so you don't reinvent the report every time:
- Sales summary: Record revenue, orders, units sold and average order value. Note refunds or unusually large orders beside the total.
- Traffic breakdown: Show sessions by source, device and period. Add conversion and add-to-cart rates, then identify the largest drop-off.
- Customer view: Compare new and returning buyers. Add useful location information and note whether a promotion attracted first-time shoppers or existing customers.
- Product view: List the three products that sold most strongly, the products with high views but few orders, and any stock concerns.
- Money check: Review gross margin, payment method split, shipping cost and refund reasons. Revenue without margin is a cheerful-looking trap.
- Action plan: Choose three to five actions, give each an owner and a deadline, and state what result you'll check in the next report.
Keep each part short. A small store doesn't need a grand corporate document. The purpose of a tracking-first report template collection is to make recurring reporting easier, not to encourage decorative pages.
Make every action testable
"Improve the website" is too vague. "Check the mobile payment step on Tuesday, remove one unnecessary field and review completed purchases on Friday" gives you something you can assess.
Save the report with the date in its filename and keep the previous version. Over time, those simple files create a useful record of product launches, seasonal demand, promotions and operational headaches. Your future self will thank you, probably while drinking the same coffee.
Charts That Earn Their Place
A chart earns its space by answering a question. If it merely makes a small seller's report look busier, leave it out. Start with the decision you need to make, then choose the chart that makes the answer easy to spot.
Use a line chart for sales across days or weeks. A table records every value, while a line shows a Friday spike or a quiet Monday at a glance. For a handmade clothing brand, mark a product launch, paid promotion or stockout on the same timeline. That stops a business event from looking like a mysterious change in demand.
Use a funnel chart for the path from visit to purchase. Include product view, add-to-cart, checkout start and completed payment if your tracking supports those events. Compare the shape with a relevant South African conversion benchmark where one is available, then check which stage creates the largest drop. If add-to-cart activity is healthy but purchases are weak, examine shipping cost, payment failure, account creation and trust concerns as separate possible causes rather than treating abandonment as a single unexplained loss.
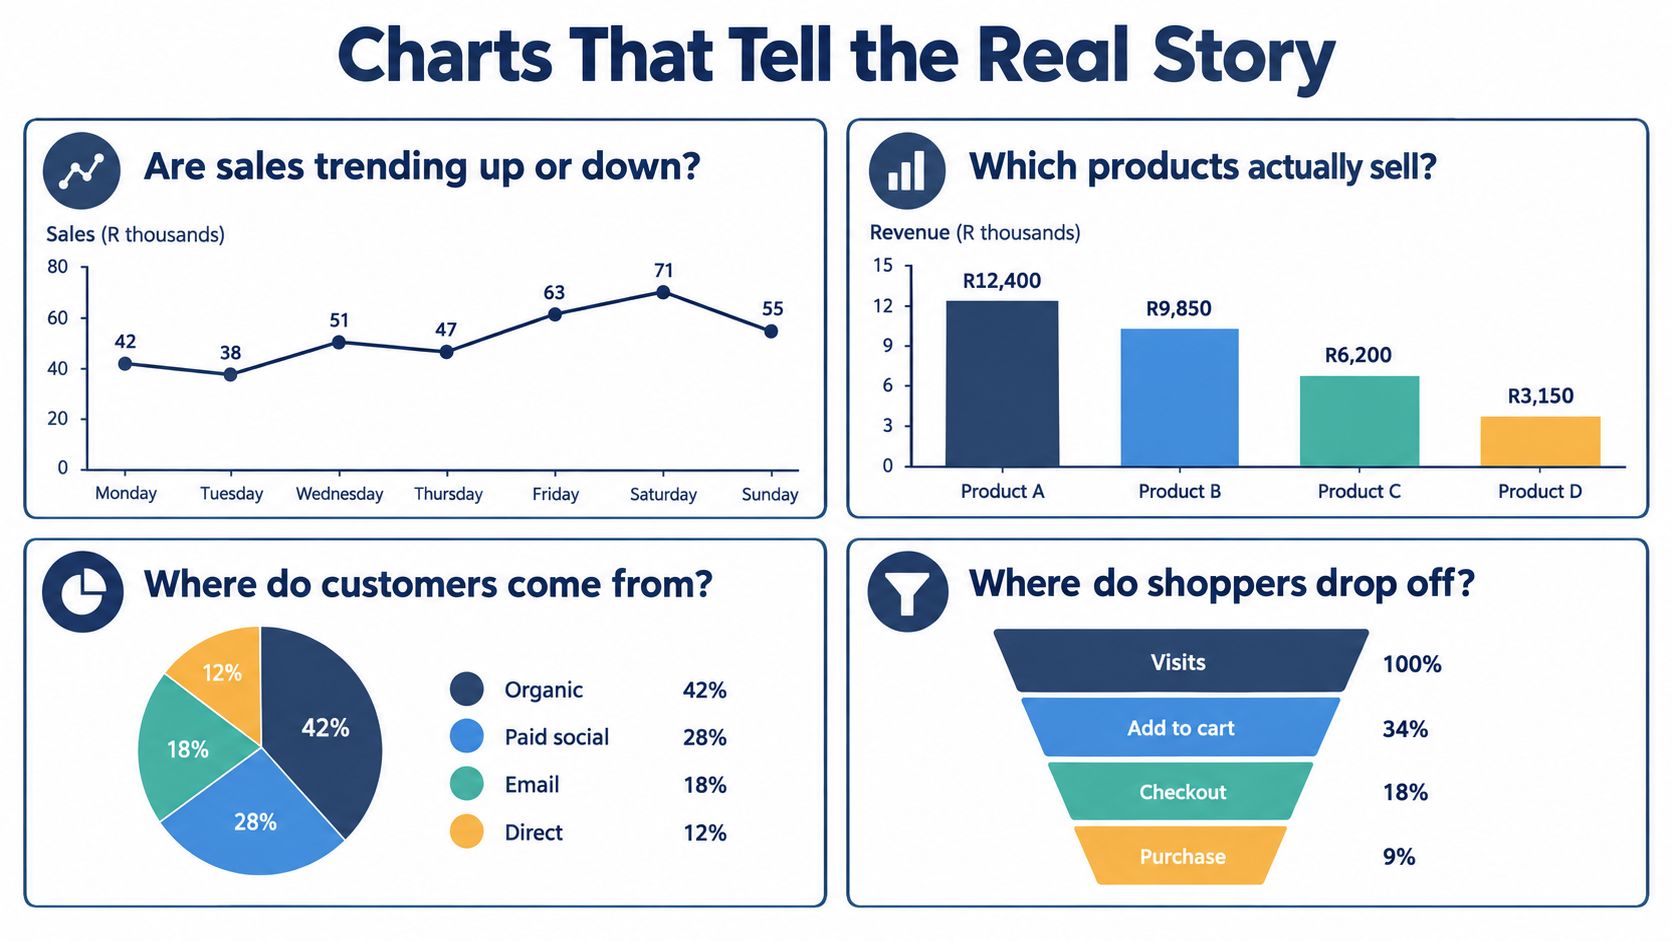
A donut chart compares device or payment-method share when you have only a few clear categories. South African shopping is strongly mobile-led, with 70% of purchases during Black Friday 2025 made via mobile devices, according to Statistics South Africa's ecommerce release. Use that figure as market context, then compare it with your own mobile conversion. A mobile-heavy audience may also show different behaviour across cards, Instant EFT and PayShap, so keep those payment routes visible when the data supports it.
A bar chart ranks products or traffic sources. Put product names on the horizontal axis and orders or revenue on the vertical axis. A KPI tile suits three or four headline figures, such as conversion rate, average order value, refund rate and gross margin. Skip a pie chart for a long product list. Once the slices resemble crumbs, the chart has stopped helping.
For a straightforward view of sales, customers, products and traffic, review this sales dashboard guide. Keep colours consistent between reports. If blue means paid traffic this month, it should not mean returning customers next month.
Turning Your Report Into Better Sales
A report becomes valuable when it changes what you do. Choose the problem with the clearest evidence, make one sensible adjustment and give it a deadline.
When shoppers show interest but don't pay
If your add-to-cart rate looks healthy but completed purchases remain weak, inspect the checkout on a mobile phone. Ask a friend to place a test order while you watch for confusing delivery costs, slow payment redirects, missing confirmation messages or an account-creation requirement that appears too late.
Local payment behaviour deserves attention. South African buyers may expect cards, EFT, wallets or newer local payment routes, so a single payment option can leave a useful customer stranded. Test the checkout yourself with the payment methods you offer, then record where the process feels uncertain.
When the basket is too small
A low average order value doesn't always mean your prices are wrong. It may mean customers don't see a reason to add a second item. A jewellery seller could pair a slower bracelet with a popular pair of earrings, while a candle maker could create a gift bundle around a frequently purchased scent.
Show the bundle clearly on the product page and in the cart. Measure orders, average order value and margin together. A larger basket that relies on a deep discount may look impressive while leaving less money behind.
When one traffic source does all the work
Your traffic report may show that most visitors arrive from one social platform, one influencer or one paid campaign. That concentration creates a practical risk. If the platform changes reach, the influencer stops posting or the campaign becomes expensive, your store has no second route to customers.
Choose one additional channel to test this month. A jewellery brand might publish short making videos on TikTok, while a Durban-focused homeware seller could create locally relevant Meta content. Give the test a clear owner, a start date and a small set of measures, including sessions, add-to-cart, orders and margin.
The useful question isn't “Did traffic rise?” It's “Which change brought profitable orders, and can I repeat it?”
Building a Reporting Habit That Lasts
A report shouldn't disappear into a folder after you read it. Treat it as a living note that records what happened, what you changed and what you learned.
On Monday, spend about 20 minutes checking the weekend's sales, top products and site traffic, as recommended in the reporting rhythm shown below. On Wednesday, look at conversion and cart abandonment for anything unusual. On Friday, compare prices and promotions with key competitors if you can do so fairly. These checks are small enough to fit around making stock, packing parcels and answering WhatsApp messages.
Your weekly glance
- Sales totals: Check revenue, orders and units sold.
- Conversion: Look for changes in conversion and add-to-cart behaviour.
- Traffic sources: Note where visitors came from and whether one source dominates.
- Top SKUs: Identify what sold, what attracted views and what needs attention.
- Payment split: Look for unexpected changes or signs of failed payment.
- Refund reasons: Record whether refunds relate to product expectations, delivery or payment confusion.
Your monthly review
Compare the current month with the previous month and, where you have enough history, the same month in the prior year. Review repeat customer behaviour, average order value, traffic-source shifts, product margin and refund reasons. Then write one short paragraph answering: what worked, what didn't and what will change next?
You don't need a report to build a strong operating habit. A tidy weekly review can beat a beautiful document that you create once and never open again. Keep the language simple, keep the measures consistent and let each report lead to one practical test.
Shopstar gives makers a way to start and manage an online store with local payments, shipping, orders, inventory and analytics in one dashboard, along with tools for selling through channels such as Instagram, Facebook and WhatsApp. Visit Shopstar to explore the platform and use your first ecommerce analysis report to decide what to improve next.